On-demand analyses
About
On-demand analyses and visualisations, such as web apps and dashboards, are essential to keep track of the rapidly accumulating data in ecological databases. Such interactive and visual syntheses are a great way to communicate current ecological knowledge to a broad audience (scientists, managers, policy makers, citizens, etc.). Such interactive platforms are designed to target specific fields or questions, for instance evidence in invasion biology theory, current state of biodiversity trends or evidence-based restoration methods.
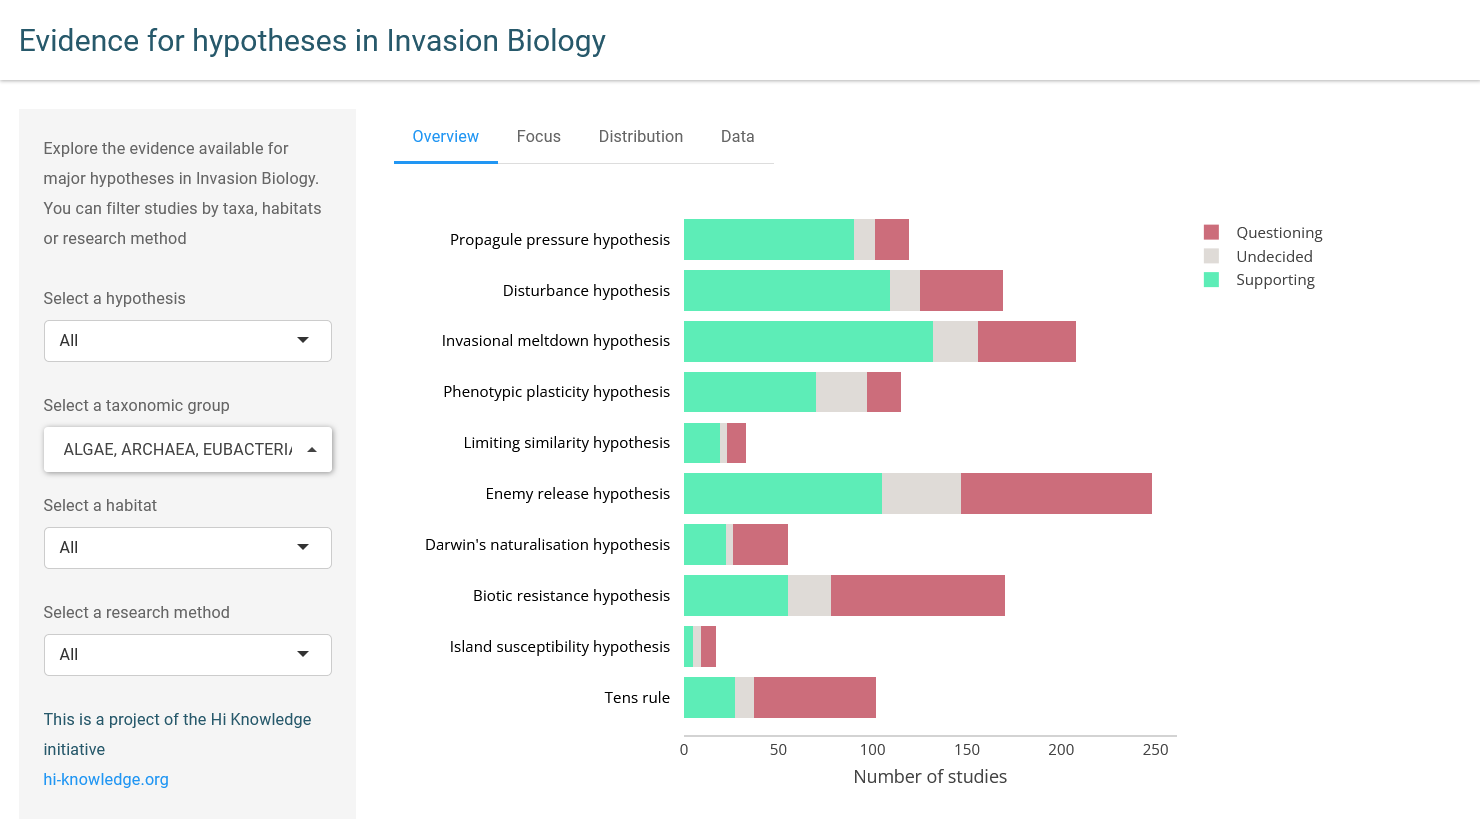
Example: Hypothesis evidence explorer
We created an R shiny app providing an interactive synthesis of the Hi Knowledge dataset for 10 major hypotheses in invasion biology (Jeschke & Heger 2018). The app synthesizes standardised information annotated in ORKG (internal link) for each paper about taxa, habitats, methods, continents, and whether or not the study supports one of 10 major hypotheses in invasion biology. Explore the web app:
